
As the spectre of inflation subsided towards the close of 2023, the unfolding events in Israel and Gaza post the October 7th terrorist attacks emerged as the latest impediment to the growth trajectory of UK corporates.
While the surge in shipping costs originating from the Red Sea crisis appears comparatively minor when juxtaposed with the pandemic-induced spike that saw container prices soar to over $18,000, it has nonetheless given rise to a cascade of challenges within the supply chain. These challenges, in turn, exert substantial pressure on margins, posing a threat to the seamless pursuit of profitability for UK corporates in 2024.
Recognising the profound impact of these developments, Birchstone Markets acknowledges that treasury risks extend deeply into the supply chain cycle. To address these challenges head-on, we are pleased to announce our strategic partnership with the respected shipping advisor, Drewry Shipping Consultants. This collaboration aims to provide business leaders with the most comprehensive and insightful research.
In collaboration with Drewry experts, we have meticulously examined various scenarios, delving into the repercussions on timelines, costs, and margins stemming from continued diversions around the Cape of Good Hope.
This report offers a detailed analysis of the potential impacts on your organisation’s financial landscape, empowering you with valuable insights to navigate the complexities of the evolving global market.
The Drewry supply/demand index is a leading analytical tool to demonstrate balance between supply and demand in the container shipping sector. An index number over 100 means demand exceeds supply, and you are likely to get elevated freight rates (as seen during the Covid-19 Pandemic). Below 100 means we are in a market where supply exceeds demand, and the overcapacity generally leads to lower freight rates. However, this can be impacted by global events, such as the Red Sea crisis.
Impact of the Red Sea Crisis
Drewry Supply and Demand Index
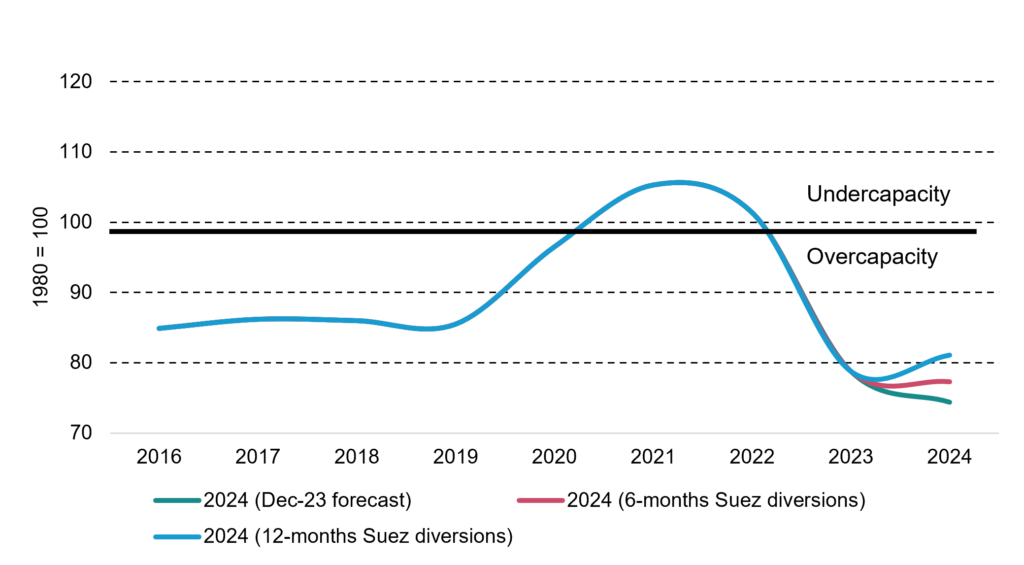
Source: Drewry Maritime Research
Drewry has run two scenarios to demonstrate the impact of the Red Sea crisis on Supply and Demand (see chart) One is for diversion to last 6 months, the other for 12 months.
In the worse-case scenario, whereby Suez has to be avoided for the entirety of 2024, assuming a 30% increase in trade distance for the roughly 30% of container ship capacity that previously transited Suez, that would reduce effective capacity by some 9% (30%*30%).
It might seem like a big number but stripping out 9% of the effective capacity for the entire year, all other things being equal, only raises the index value to around 81 – well short of the 100 marker that signifies global market balance.
As this is just a global average. The impact will land hardest on trades previously connected by the Suez Canal, which is why spot rates on trades such as Asia to North Europe skyrocketed in recent weeks.
The Drewry World Container Index reports actual spot container freight rates for major East West trade routes. The Index consists of 8 route-specific indices representing individual shipping routes and a composite index. All indices are reported in USD per 40ft Container.
The chart below demonstrates the evolution of spot rates on the Shanghai – Rotterdam trade lane from 2017 until week 5 of 2024.
WCI Rate analysis Shanghai
Rotterdam (US$40FT)
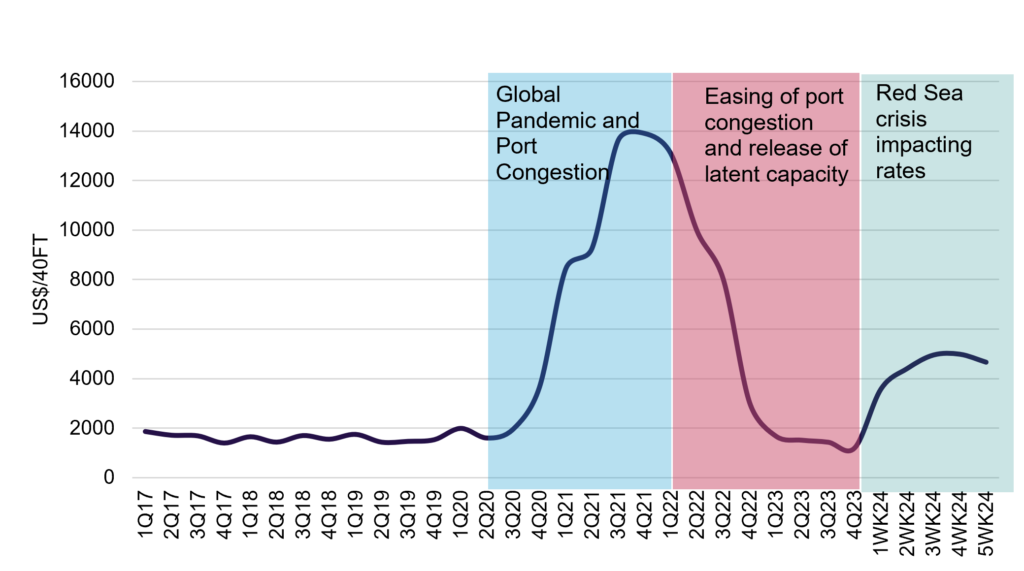
Source: Drewry World Container Index
Up until December 2023 we were seeing ‘normality’ returning to the market and expecting rates to bottom out for the year. However, this got turned on its head on the 15th December with the rerouting of vessels round the Cape of Good Hope as the Red Sea crisis escalated, and carriers stopped transiting through the Suez Canal.
Since this date we have seen the following:
- Spot rates up more than 300% on the routes from Asia to Europe/Med since mid-November; spot rates up more than 90% from Asia to USEC and USWC
- Carriers implementing surcharges of $500-2,500 per container to re-route ships
- Additional surcharges for cargoes to/from Red Sea
In terms of what happens next our view is that rates on affected trades will remain elevated for the duration of the crisis, which is uncertain, but that they won’t go so high to stoke inflation.
Our rationale is that the current situation is only partly comparable to the pandemic:
- During lockdowns there was a surge in demand for physical containerised goods, which when coupled with disruption across every link of the supply chain sent shipping costs into orbit.
- These days demand is much more pedestrian now that government stimulus has wound down and spending habits have reverted back to services.
- The surplus of containerships is much greater today than it was during the pandemic; that’s bad news in normal times for carriers, but it provides more resilience to cope with disruptive events.
- It takes time to reposition ships so the pinch will be worse at this initial stage, but things should ease once Red Sea diversions become part of longer-term planning by carriers.
Ocean Freight Costs Impact on Cargo Margins
Based on data from UNCTAD, long-term average container freight rates range from as little as 0.1% of retail value for sport shoes to as much as 13.8% for furniture.
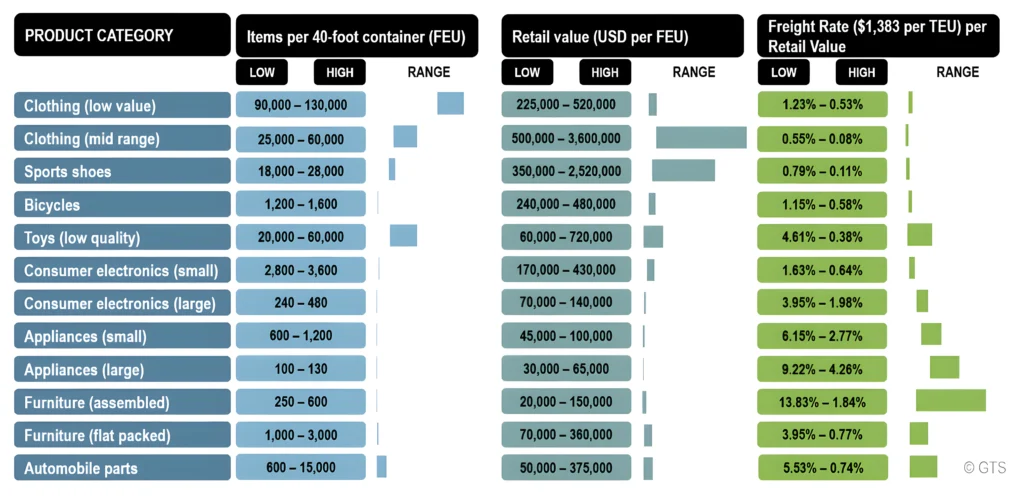
Source: Adapted from OECD (2005) DSTI/DOT/MTC(2005)5/REV1, The role of changing transport costs and technology in industrial relocation. Note: 2 TEU per 1 FEU. Freight rate of $1,383 per TEU based on average spot freight rates between 2010 and 2019 for Shanghai-Europe and Shanghai-US West Coast trade routes.
For companies trading goods internationally and using container shipping, this means that some of them have minimal profit margin exposure to changes in container shipping costs whereas other companies will see their profits halve or more if their shipping costs double or triple.
Assuming that a company has an average 20% net margin as a percentage of retail revenue, a doubling of container shipping costs will reduce margins as follows, depending on the industry sector:
- Premium sport shoes: from 20% at normal shipping prices to 19.9% at doubled shipping prices.
- Low value clothing: from 20% at normal shipping prices to 19.1% at doubled shipping prices.
- Large appliances: from 20% at normal shipping prices to 13.2% at doubled shipping prices.
- Low value furniture: from 20% at normal shipping prices to 6.2% at doubled shipping prices.
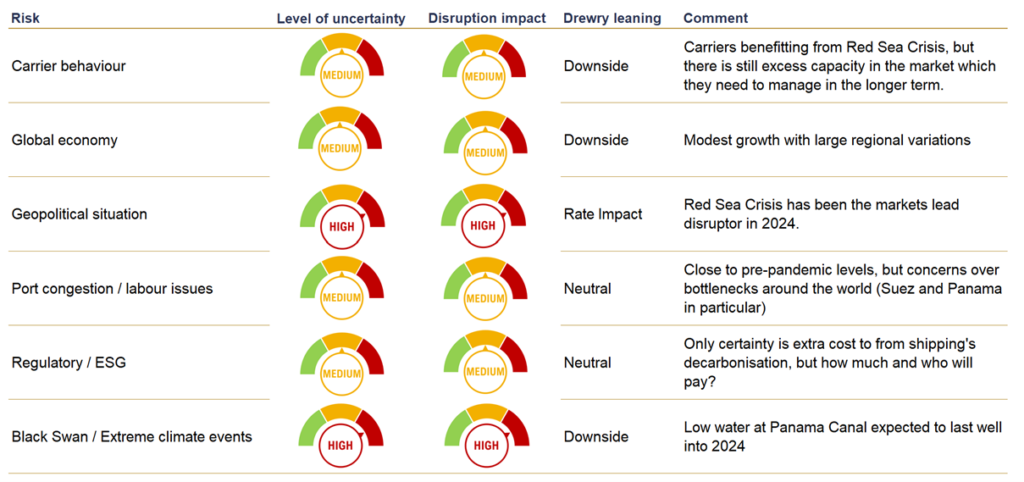
Drewry risk register
Summary of risks and sensitivities to the forecast
Source: Drewry Maritime Research
Drewry has determined what the key risk factors impacting the container sector, and use these to formulate working assumptions within its forecasts (see table).
The Red Sea crisis is the current major industry disruptor and our working assumption is that it will last at least the first 6 months of the year. This subsequently drives carrier behaviour in terms of vessel deployment, schedule and rates, which is what the shipping community is directly impacted by.
Report produced by Drewry Shipping Research and Birchstone Markets.
Contributers

Jonathan Pryor
Managing Director at Birchstone Markets

Chantal McRoberts
Director at Drewry Supply Chain Advisors
